MBO Radio Jove High Resolution Graphs
These graphs are produced from data captured from our Radio Jove receiver every 1/10th of a second. This data is then synchronised every 5 minutes from MBO to this web server and the graphs are generated a minute after.
Graph of last 10 minutes activity
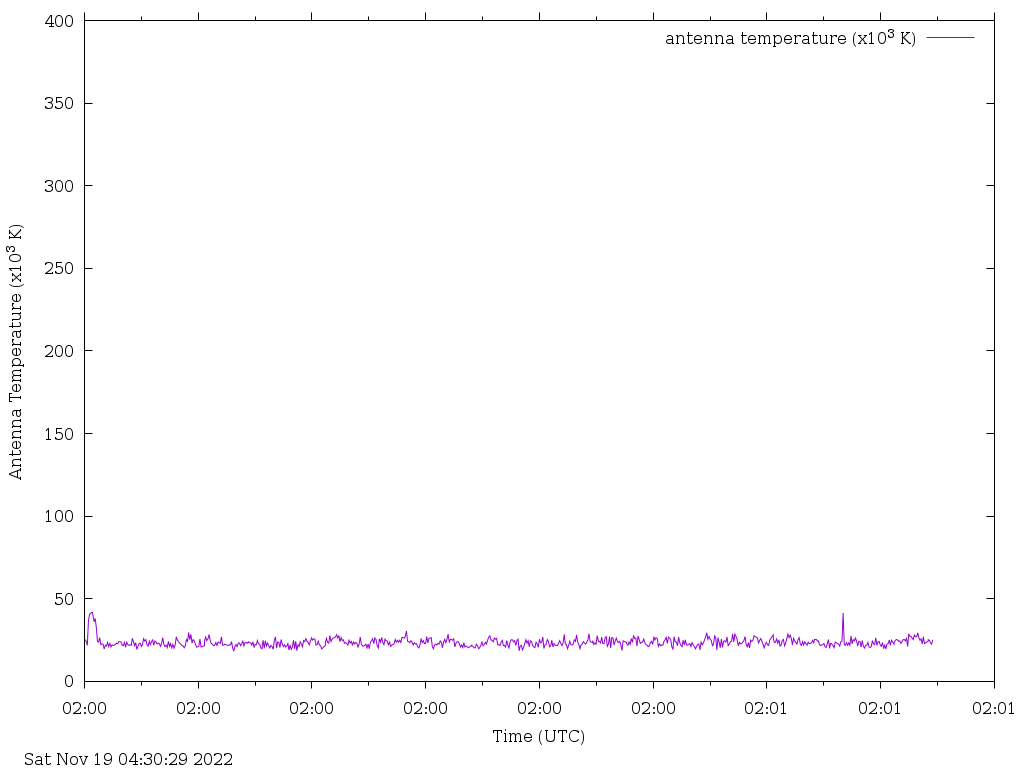
Graph of last hours activity

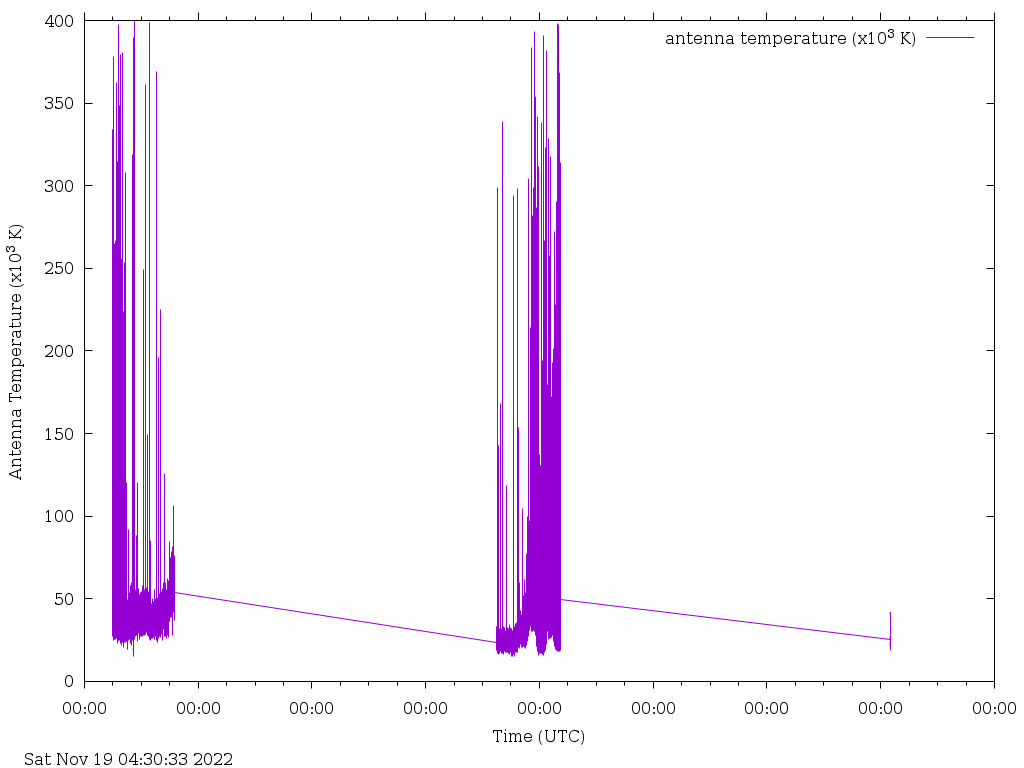
Graph of last two hours activity

Graph of last days activity

Graph of last weeks activity
Raw data access
Currently you can browse the raw CSV data that is uploaded every 5 minutes to our online archive site.